Tackling Urban Debris: Insights from Australia’s Metropolitan Clean-Up Efforts
Another day, another study on plastic pollution, but this one’s a bit different. Instead of focusing solely on ocean gyres or remote beaches, researchers from CSIRO and partner institutions turned their attention to metropolitan areas across Australia. Published in Marine Pollution Bulletin, the paper, led by Stephanie Brodie, offers a rare continental-scale snapshot of environmental debris in urban and coastal zones (Brodie et al., 2025). Spoiler alert: there’s both good and bad news. Let’s unpack what they found, and what it means for cities worldwide.
The Big Picture: What Did They Do?
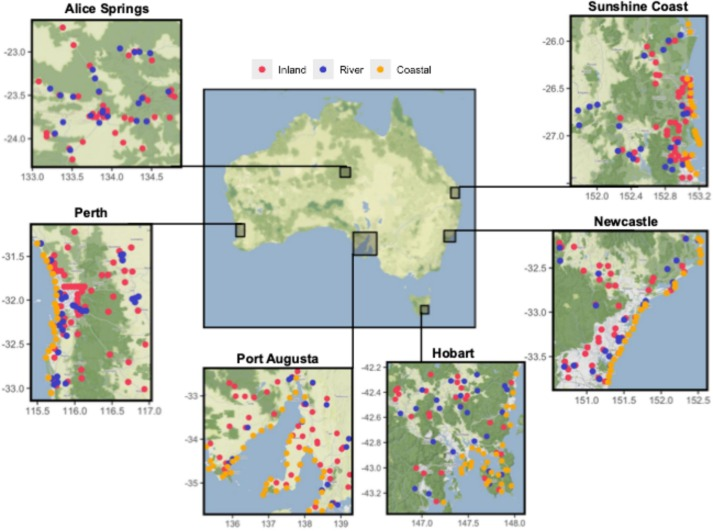
The team surveyed six Australian cities: Alice Springs, Hobart, Newcastle, Perth, Port Augusta, and Sunshine Coast; between 2022 and 2024. Using a stratified random approach, they examined 1,907 transects across inland, riverine, and coastal habitats. Think of transects as systematic sweeps of land or shoreline, where researchers recorded every piece of debris within a defined area. They counted everything from cigarette butts to polystyrene fragments, categorising over 8,383 items. To assess trends, they compared coastal data to a similar survey done a decade earlier.
Key Findings: The Good, the Bad, and the Ugly
First, the good news: coastal debris density dropped by 39% nationally since 2013, and the number of pristine transects (with zero debris) increased by 16%. This suggests policies like plastic bag bans, container deposit schemes, and community clean-ups are working. Cities like Perth and Sunshine Coast saw notable improvements, likely due to local custodianship and targeted campaigns.
Now, the not-so-good bits. Debris isn’t evenly distributed. Urban and socio-economically disadvantaged areas bore the brunt of pollution, with hotspots near roads, commercial zones, and residential areas. Plastic dominated the debris mix: hard fragments, food wrappers, and bottle caps were everywhere. But the real villain? Cigarette butts. They topped the list of whole items found, appearing in 20% of transects. Polystyrene fragments, though less widespread, formed 24% of all debris by count, often concentrated in specific sites.

Why Does Debris Cluster in Cities?
The study highlights a few drivers. Proximity to roads mattered. Transects near highways or busy streets had more litter, likely from passing traffic. Socio-economic factors also played a role: disadvantaged neighbourhoods consistently had higher debris loads. This aligns with global patterns where under-resourced areas face inadequate waste infrastructure and lower prioritisation of environmental stewardship. As one co-author noted, “When you’re struggling to make ends meet, binning your trash properly isn’t always top of mind.”
Riverbanks and coasts told their own stories. Cobblestone riverbanks trapped debris, while coastal sites with seawalls (instead of natural dunes) accumulated more litter. Interestingly, steep slopes inland had less debris, probably because gravity whisks trash downhill into waterways, which then carry it out to sea.
Lessons for Policy and Communities
The decline in coastal debris is a win, but the study underscores the need for item-specific interventions. For example:
- Cigarette butts: Despite being tiny, they’re toxic and pervasive. The authors suggest levies on tobacco products to fund clean-ups, alongside “no litter” campaigns.
- Polystyrene: Its tendency to crumble into microplastics makes it a nightmare to clean. Phasing out expanded polystyrene in packaging, as proposed in Australia’s National Plastics Plan, could curb this.
- Bottle caps: Container deposit schemes often exclude caps, leading to mismanagement. Policies requiring caps to stay attached to bottles (as in the EU) might help.
The paper also praises local custodianship. Volunteer clean-ups, school programs, and public awareness campaigns clearly move the needle. In Hobart, where container deposit schemes were absent, beverage bottle litter was notably higher, proof that policy works when enforced.
What’s Next?
While the study offers hope, it also flags gaps. For instance, seasonal variations weren’t fully explored. Heavy rains in Alice Springs before the survey likely flushed lighter debris downstream, skewing results. Future research could track debris movement during wet and dry seasons to refine models.
Another priority? Standardised monitoring. The team used CSIRO’s Global Plastic Pollution Baseline methodology, which could be adopted by citizen scientists globally. Imagine an app where hikers or beachgoers log debris, this crowdsourced data could fill spatial and temporal gaps.
Lastly, the authors stress equity in waste management. Improving bin access, education, and infrastructure in disadvantaged areas isn’t just about fairness, it’s a practical step to reduce pollution. As Brodie notes, “Debris isn’t just an environmental issue. It’s a social one.”
References
- Mar. Pollut. Bull.Drivers of environmental debris in metropolitan areas: A continental scale assessmentMarine Pollution Bulletin, Apr 2025
Enjoy Reading This Article?
Here are some more articles you might like to read next: